
Explore the Science
o
NBEP Science
Learn more about the Narragansett Bay Estuary Program’s contribution to science in our region. As new science becomes available, we work with partners to piece together the story of our region.
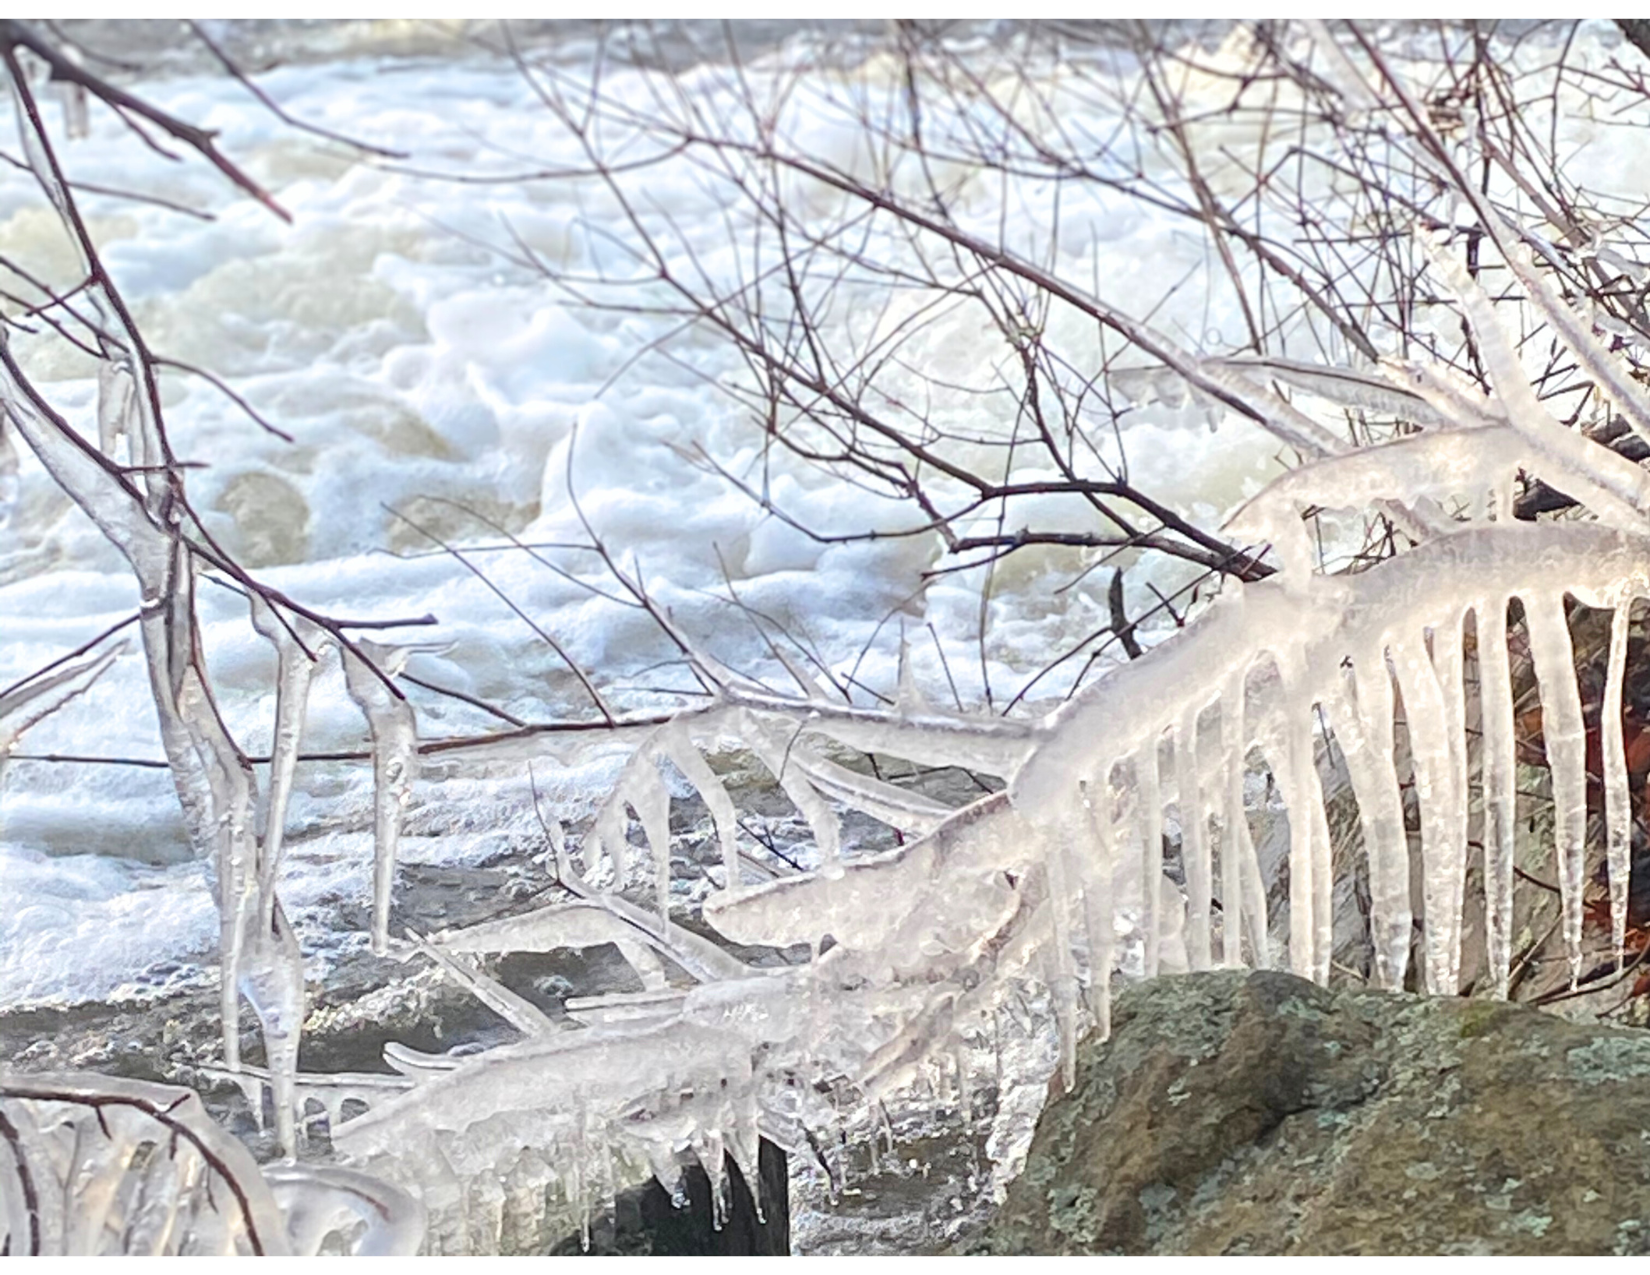
Rain & Snow
Precipitation and snowfall have changed throughout the region. Explore this update to the State of Narragansett Bay and Its Watershed!

Ocean Acidification
Carbon dioxide is making the ocean more acidic. Explore what that means for the Narragansett Bay Region!

Research Plan
NBEP released its first ever Research Plan which creates the Coastal Urban Watershed Collaborative and funds science needed for Vision 2034.
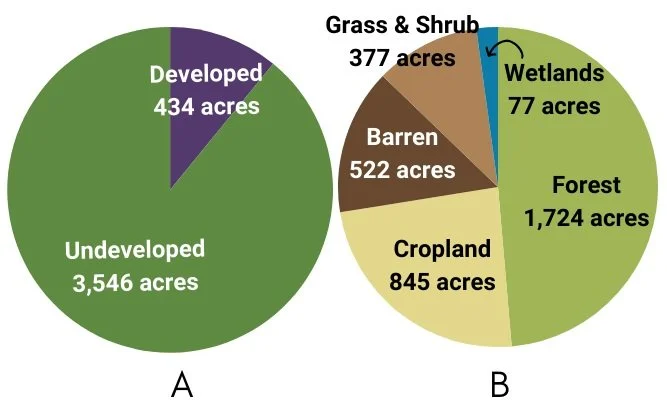
Solar Projects in the Forest
Nearly 4,000 acres of land have been converted to solar projects; over 1,700 acres in the forest alone. What is the best use of a parcel of land?

Seagrass Meadows
NBEP updated and expanded the Seagrass Indicator to include the Coastal Salt Ponds and Little Narragansett Bay

Social and Environmental Science
NBEP and its Social Science Working Group explore indicators to measure how the region values and uses its resources

Clean Water and Quahogs - Storymap
Efforts to improve water quality have led to new shellfishing areas being opened to the public.
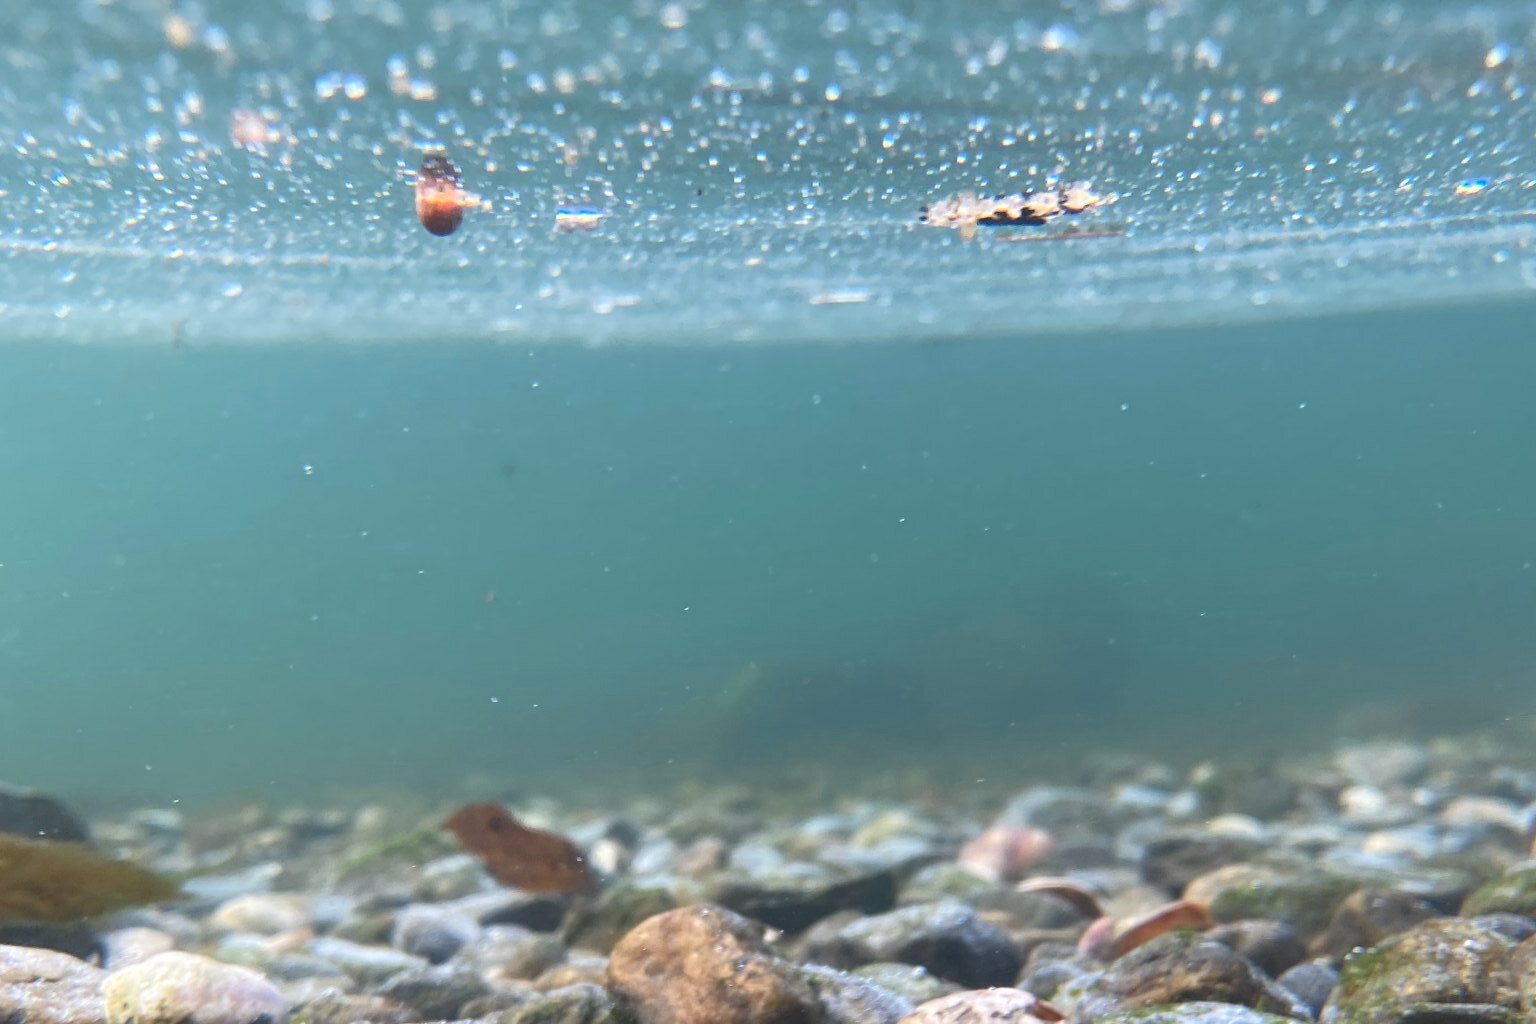
Can We See Our Toes?
This science indicator update explores changes water clarity in Narragansett Bay over time.
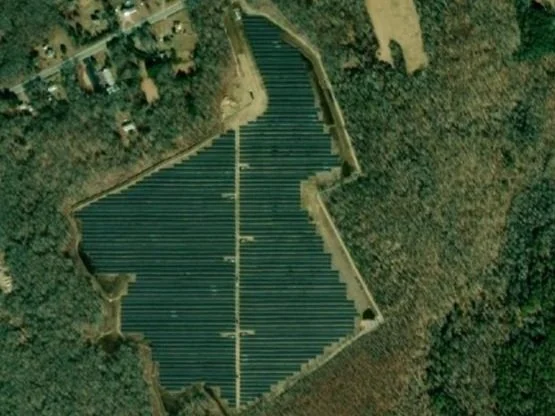
Solar Fields in Forests
How do we balance energy needs with forest benefits? This update explores ground-mounted solar arrays in the Narragansett Bay Region
Improved Water Quality
Nitrogen pollution reduction over the last 15+ years shows improvement in Narragansett Bay water quality.
View Webinar
What Goes Up Must Come Down
New data released by Brown University describes atmospheric nitrogen deposition in Narragansett Bay

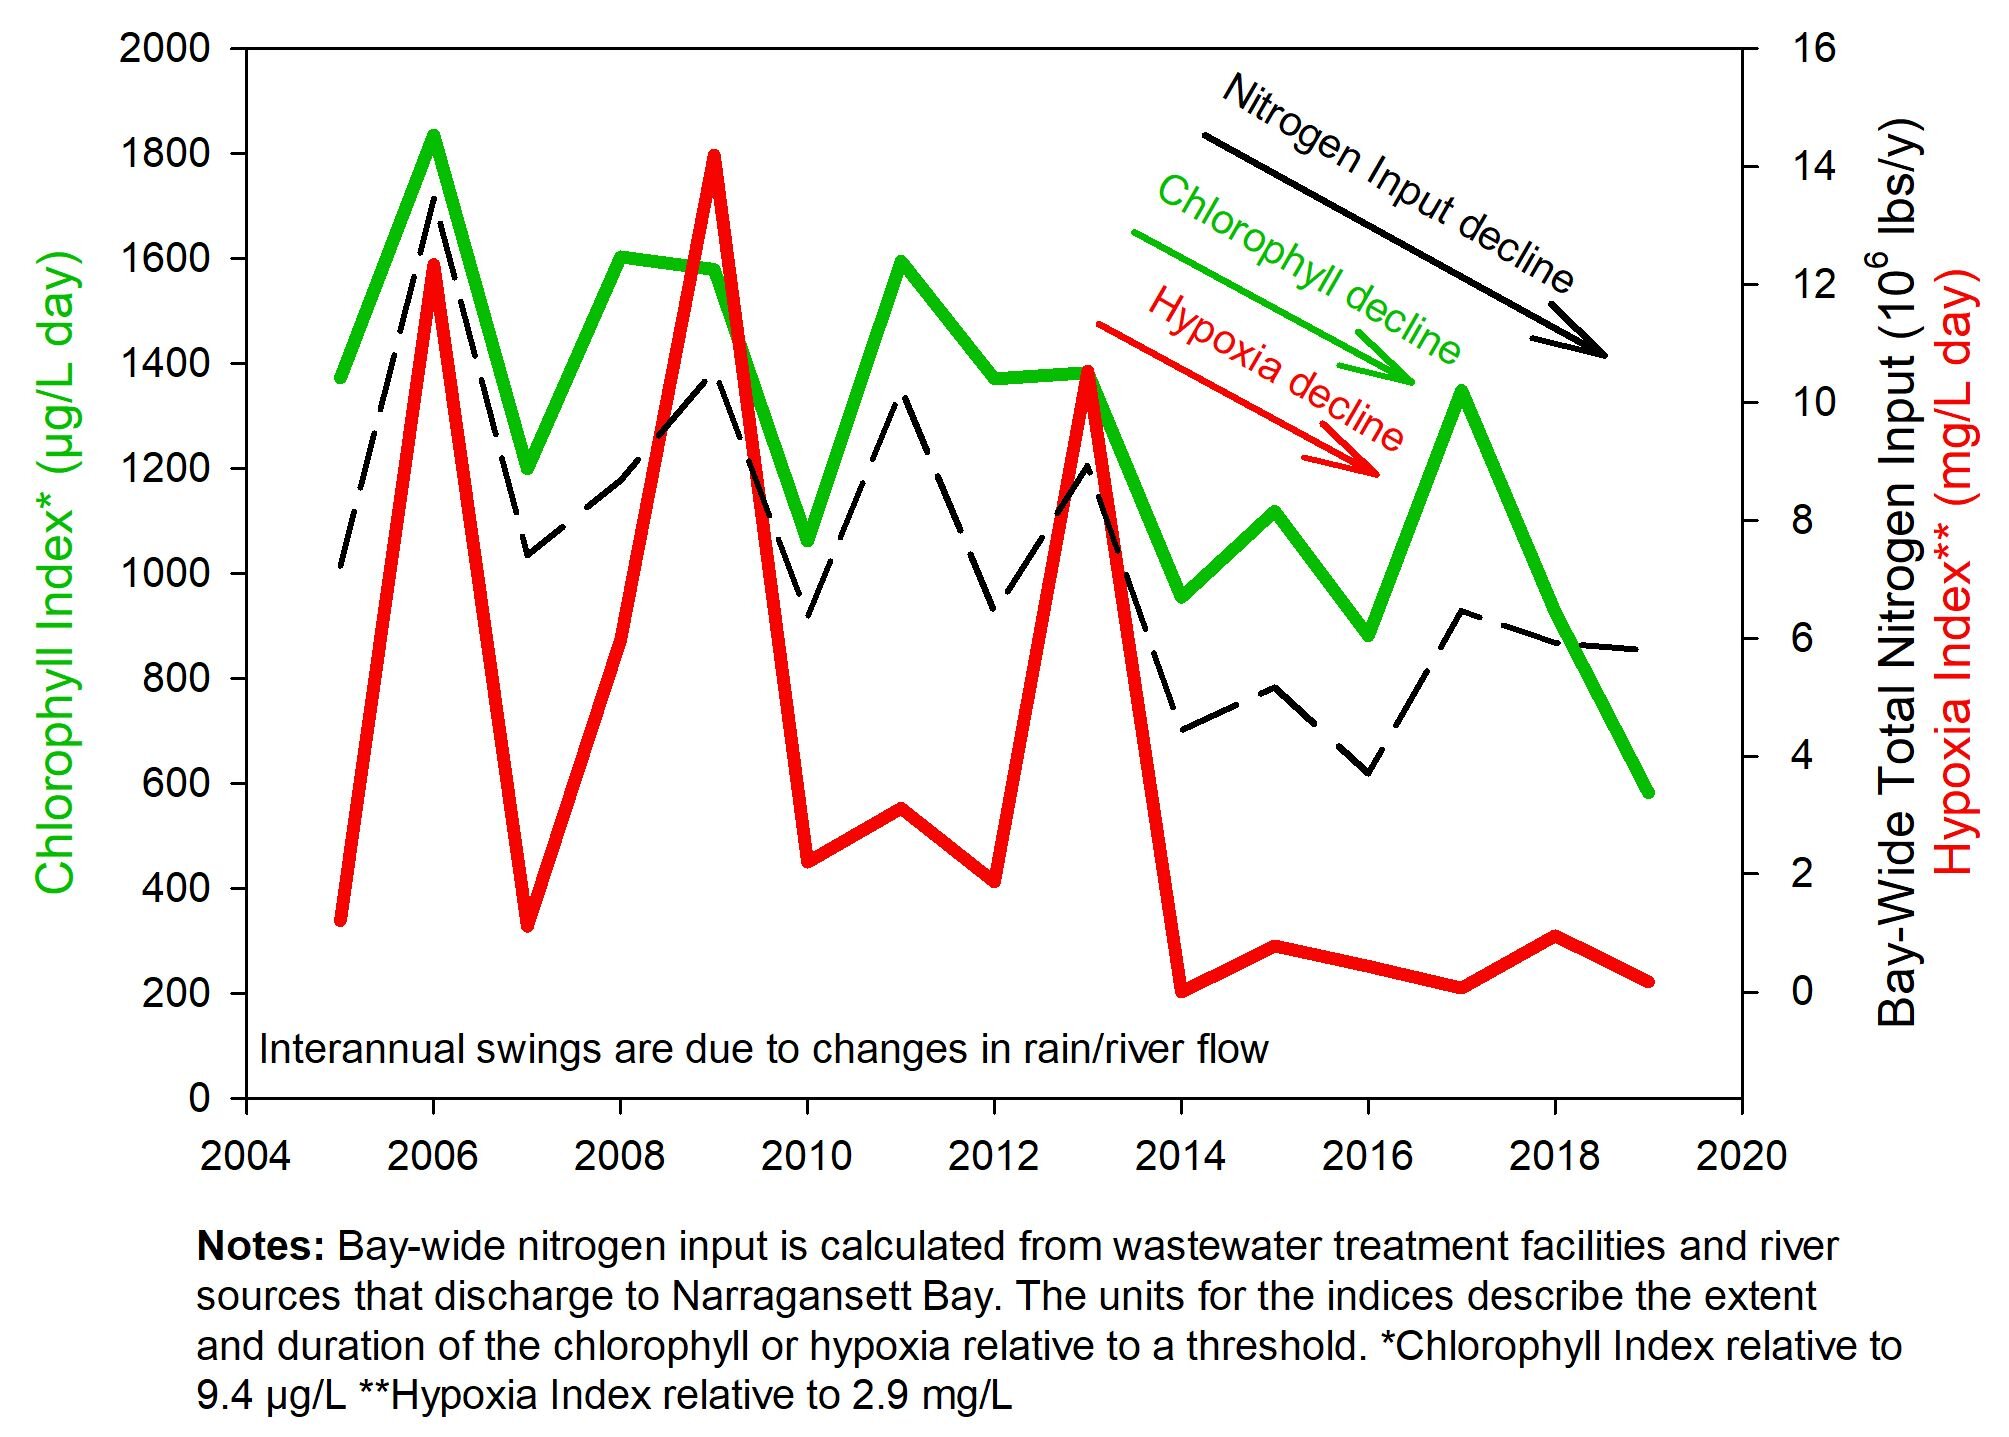
Lower Nutrients Means More Oxygen
A new in-depth investigation of oxygen, chlorophyll, temperature and the influencing factors of nitrogen load, river flow, salinity, stratification, and more in Narragansett Bay.
Land Use
Tracking land use is key to understanding how best to protect our watersheds.

Nuisance Flooding
Seas are rising and tides are getting higher. Higher tides means more “sunny day” flooding.

How Do We Use Our Coasts? - StoryMap
Advances in cell phone data provide insight into patterns of use along the shores of the Narragansett Bay region.

Narragansett Bay Watershed Economy
The plentiful natural capital of our region is central to a robust New England economy. This report examines the value of 13 critical industry sectors that rely on natural capital.

STORMTOOLS 2020
STORMTOOLS provides hazard information for extreme storm events at multiple sea level rise scenarios. University of Rhode Island recently updated its high resolution modeling for Narragansett Bay.

Recovery on the Sea Floor - StoryMap
Dive into thirty years of change—for the better—on the sea floor of the Narragansett Bay.

Physical Oceanography - New Research
An in-depth investigation of oxygen, chlorophyll, temperature and the influencing factors of nitrogen load, river flow, salinity, stratification, and more in Narragansett Bay.

Watershed Nutrient Budget - New Research
Daily total nitrogen load from 2001-2017 from 18 sources: 11 wastewater treatment facilities (9 in RI, 2 in MA); 6 rivers (including upstream WWTFs); and ungauged runoff.

Landscape of Change - StoryMap
Our population and the landscape has changed dramatically over time. How fast has change happened? How will this region continue to change? How will it impact us?